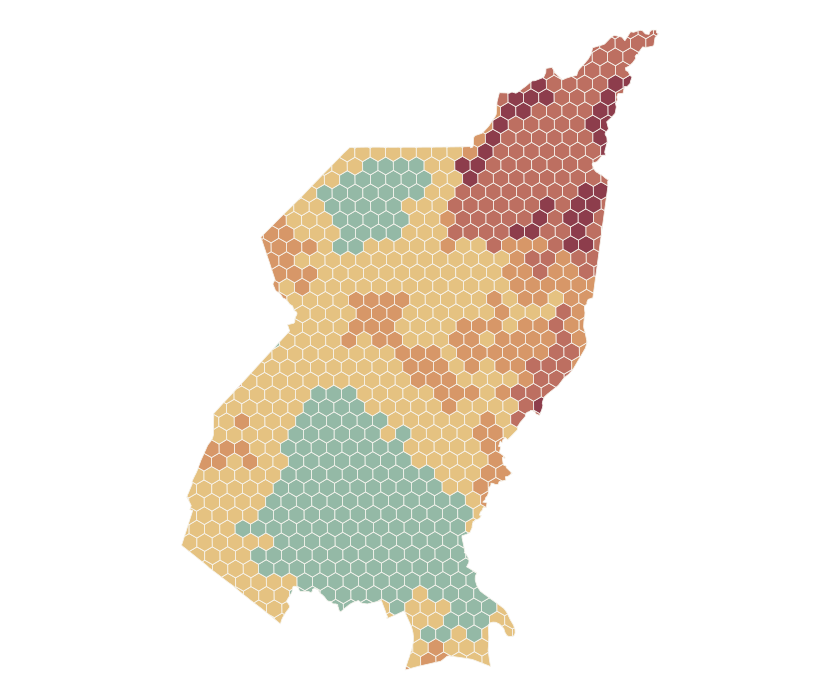
Understand why an area stands out
Travel time, the supply-and-demand gap, population exposure, and road-network gaps contribute to the score. Explanations help a reviewer see which signals pushed a neighborhood toward higher modeled risk.
A Python geospatial analysis project that turns open mapping, walking reachability, and population data into an explainable healthcare-access index.
Explore the mapA clinic can look nearby on a map while remaining difficult to reach on foot. This personal project explores where travel time, mapped facility availability, population exposure, and road connectivity may combine to make access more difficult in Quezon City.
The model divides the city into neighborhood cells and evaluates several access signals together. Risk and data confidence are reported separately, so a strong-looking score is not mistaken for strong evidence. Comparisons under different assumptions help reveal where the ranking is sensitive.
The project produces an interactive map, scored neighborhood cells, clinic reachability layers, and tables for review. Walking-access bands at 15, 30, and 45 minutes make the difference between geographic closeness and modeled reachability easier to inspect.
Each cell carries its risk, confidence, and contributing reasons. The accompanying validation compares thresholds and weights, tests the influence of individual factors, and identifies high-risk cells for manual review. The preview uses the project’s recorded baseline.
Travel time, the supply-and-demand gap, population exposure, and road-network gaps contribute to the score. Explanations help a reviewer see which signals pushed a neighborhood toward higher modeled risk.
The index is a decision-support experiment, not a measure of care quality or patient outcomes. Mapped facilities may be incomplete, population inputs are optional, and some validation scenarios could not be completed because reachability data was missing. These limits matter when interpreting the map.
The command-line pipeline uses GeoPandas, Shapely, PyProj, Pandas, and NumPy to combine an OpenStreetMap city boundary, mapped healthcare facilities, and road geometry. OSMnx handles the mapping inputs. Spatial work is projected into EPSG:32651 so grid dimensions, areas, and distances are calculated in meters; published GeoJSON returns to EPSG:4326.
A 500-meter default hex grid is clipped to the city boundary, retaining partial and multipart edge cells. Optional WorldPop population rasters are checked for a coordinate system and geographic overlap, then reprojected against the cells for Rasterio and rasterstats zonal sums.
openrouteservice supplies walking isochrones at 15, 30, and 45 minutes. A deterministic cache key includes the facility identifier, coordinates rounded to six decimals, travel profile, and requested time bands. Cached GeoJSON can be reused across builds; changing the routing inputs changes the cache identity.
Requests are paced, and HTTP 403 or 429 stops the fetch sequence with an actionable error instead of repeatedly spending quota. Missing reachability is reported explicitly. A separate straight-line walking-time proxy is available, and its use is reflected in the travel source and confidence assessment.
The baseline combines travel-time risk, a supply-and-demand gap, population exposure, and road-network gaps. Continuous inputs use robust normalization against the 95th percentile with clipping; configurable weights support sensitivity checks and factor ablation.
Each output cell retains its component values, travel source, explanation reasons, risk label, and a separate confidence score. Missing population data can be allowed explicitly, but it changes the evidence available to the model rather than becoming an invisible assumption.
risk = 100 × (
  0.40 × travel_time_risk
  + 0.30 × supply_demand_gap
  + 0.20 × exposed_population_risk
  + 0.10 × road_network_gap
)The Pytest suite covers grid generation, scoring thresholds, percentile normalization, weight normalization, cache-key stability, reachability bands, and supply-and-demand calculations. HTTP failure tests check that forbidden and rate-limited requests stop further fetches.
Pipeline tests create local boundary, road, clinic, population-raster, and isochrone fixtures. Cached-input runs exercise the build and validation commands without requiring live routing calls. Outputs include scored GeoJSON, reachability layers, CSV summaries, and a Folium/Leaflet HTML map.
The recorded travel-heavy weighting scenario retained the baseline’s top 10 cells and had a rank correlation of 0.9972. A stricter travel-threshold scenario had a rank correlation of 0.9212, but only 48% overlap in the top 25. Overall ranking stability therefore does not guarantee that the same neighborhoods remain at the top of a review list.
The lenient-threshold scenario was marked incomplete because the reachability cache was missing required data. The report keeps that gap visible and prepares 25 top-risk cells for manual audit; it does not claim those audits are complete or that the score predicts patient outcomes.
The recorded baseline covers 830 neighborhood cells, with 25 high-risk cells prepared for manual review. Sensitivity checks show how changing assumptions affects rankings and labels. The tool supports inspection and reproducible analysis; it does not establish whether healthcare outcomes have improved.
Recorded project baseline. Map data © OpenStreetMap contributors; walking reachability © openrouteservice.org by HeiGIT.
A spreadsheet that’s outgrown its job. Systems that won’t talk. An idea you’re ready to test. Tell us what needs to work better.
Talk through the project